Building Statistics
Overview
Building statistics in Flexopus are created without using personal information. The calculations are based on anonymized reservations, focusing only on which resource is booked and when. Knowing which user made the reservation is irrelevant for these statistics. Therefore, the data can be stored indefinitely, in compliance with GDPR.
Building statistics
To access building statistics in Flexopus as an administrator:
- Navigate to
Dashboard > Analytics > Building statistics. - Select the timeframe and the location you want to analyze. By default, all locations are selected.
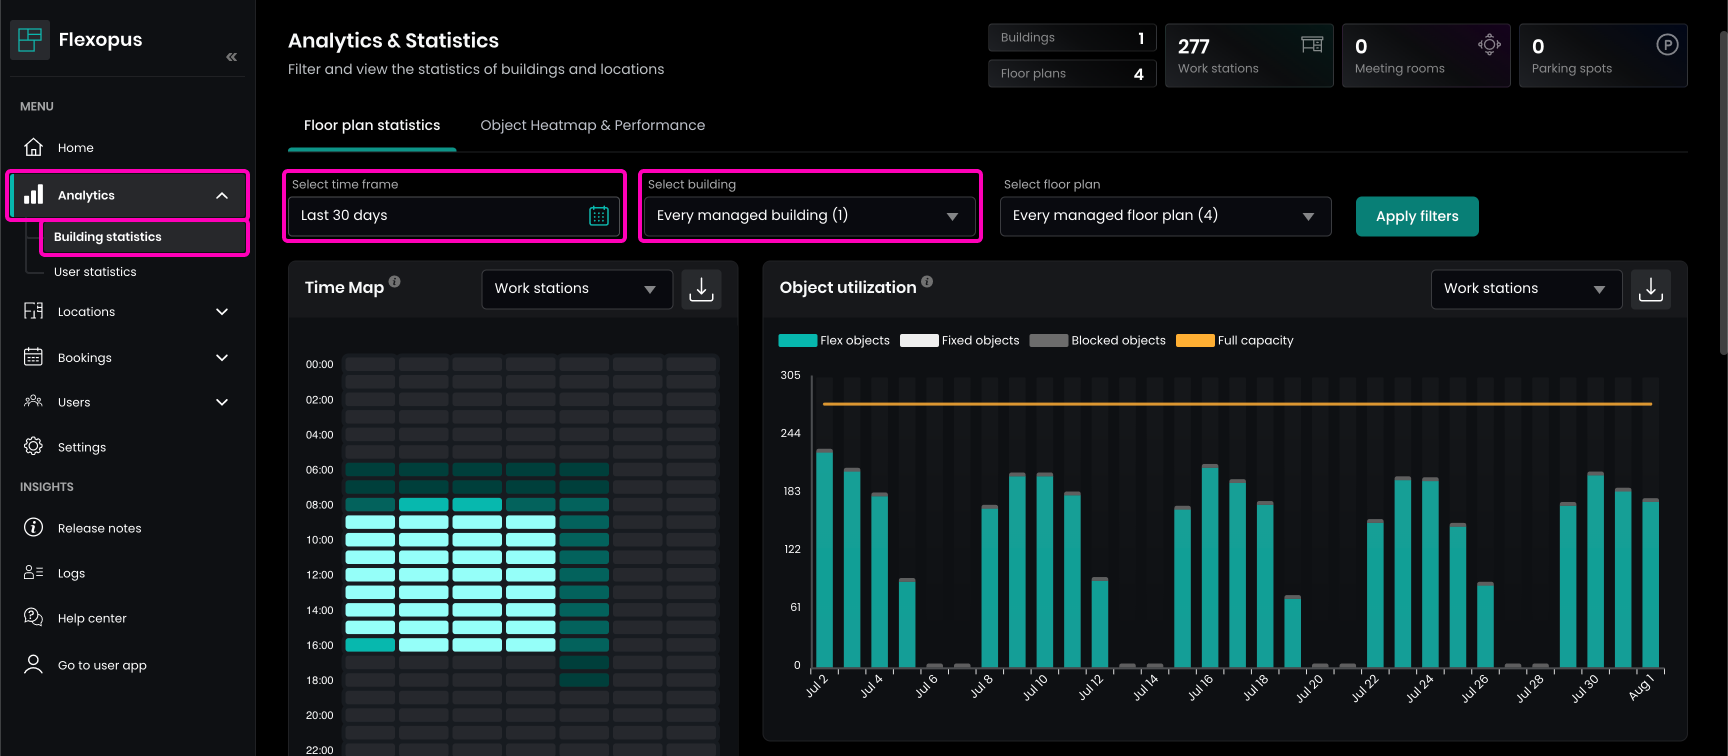
To calculate statistics, you must select a timeframe. Note the following:
- Options like months, quarters, last 30 days, last 90 days, and current year are precalculated statistics.
- Custom time selections can be up to 90 days and are calculated in real-time, which takes longer than precalculated statistics.
- Precalculated data is updated nightly, including reservations from the previous day.
Time Map
The number of reservations during the week is calculated with 60-minute accuracy to show when most colleagues are working in the office. Both flexible and permanent fixed reservations count as 1 unit, while blocked resources count as 0.
Calculation Example for Monday, 08:00–09:00:
- Value = sum of bookings / sum of days
- Sum of bookings: Total number of bookings during the selected timeframe for all Mondays in that time slot.
- Sum of days: Total number of Mondays within the selected timeframe.
This calculation helps identify office usage patterns over time.
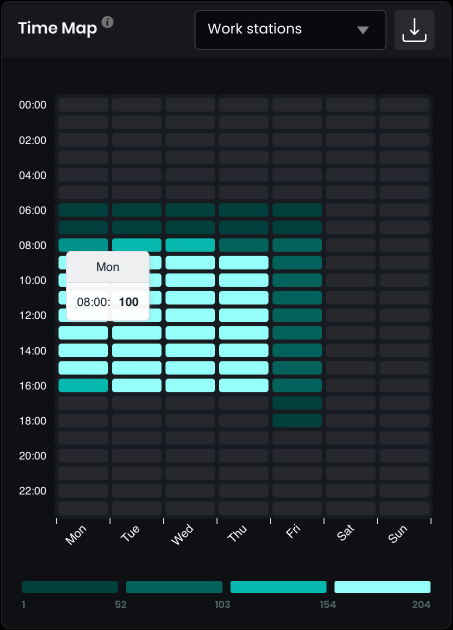
You can scope the statistics based on resource types.
Resource utilization
The utilization of a day is calculated by considering any resource with a reservation as occupied, regardless of how long it was reserved. Here's how different resources are treated:
- Flexible resources: Count as 1 if reserved, no matter the duration.
- Fixed resources: Count as 1 since they are permanently assigned.
- Blocked resources: Count as 1 because they are unavailable to anyone.
Calculation Example for a Day:
- Value = sum of occupied resources
- Sum of occupied resources: Total number of resources (flexible, fixed, or blocked) that are considered occupied on that day.
This method ensures all unavailable or used resources are included in the utilization calculation.
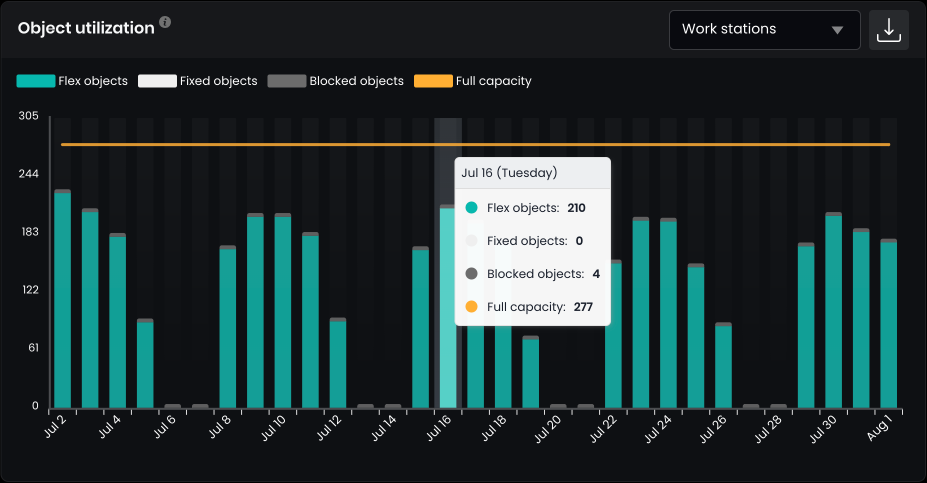
You can scope the statistics based on resource types.
Resource utilization in %
The resource utilization reflects how many of the available resources are occupied on a given day. The capacity threshold is set to 85%—a benchmark we established, not a calculated value. It can be interpreted in different ways:
- Below 85%: You have more than enough office space. You may want to consider optimizing or reducing space to save costs.
- Above 85%: You have high office demand. If you're maintaining or increasing your headcount, you might need more office space for your colleagues.
Ultimately, the utilization percentage you aim for depends on your facility management and HR goals.
Calculation example for a day:
The resource utilization percentage is calculated as follows:
Percentage = Number of occupied resources / Total number of resources
- Number of occupied resources: Number of occupied resources on that day.
- Total number of resources: The number of all available resources on the target day.
This calculation shows the resource utilization as a percentage of the total available.
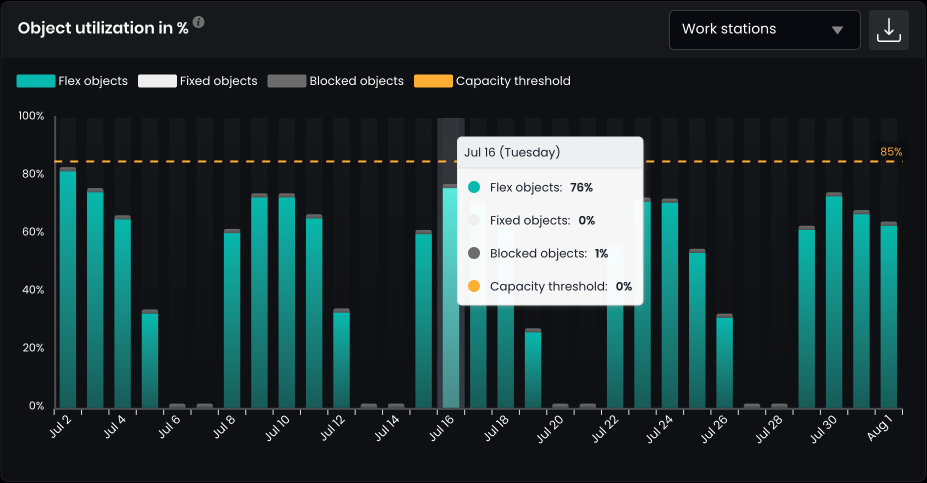
You can scope the statistics based on resource types.
Reservations in hours
The number of reservation hours is calculated daily, including normal flex reservations and permanently assigned resources, but excluding blocked resources.
Calculation Example for a Day:
- Value = total hours of reservations
- Sum hours: The total number of booking hours for that day.
This metric helps track the distribution of working hours over time. It provides insights into employee behavior, such as reduced office hours before weekends or holidays. A significant drop in reservation hours might also indicate an anomaly that can be quickly identified.
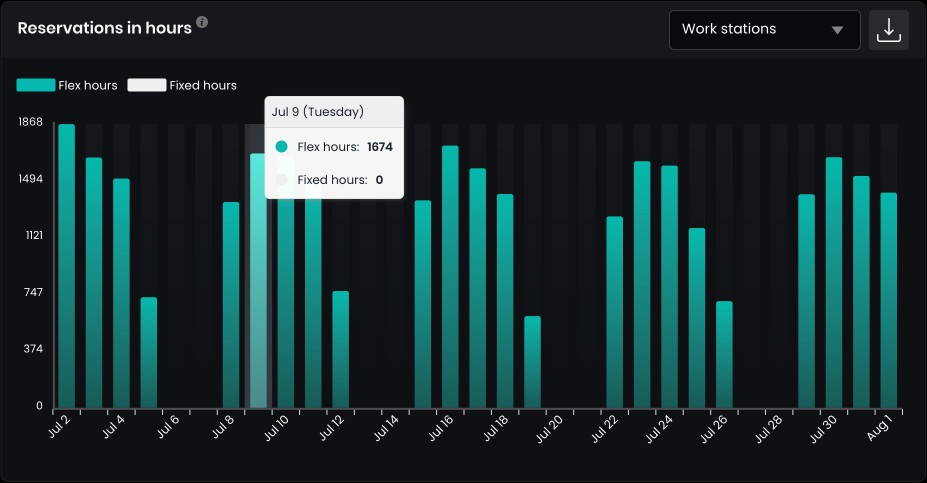
You can scope the statistics based on resource types.
Reservations (per day in average)
The number of reservations during the week is calculated daily to show how bookings are distributed across weekdays. Both flexible reservations and permanently fixed reservations are counted as 1 unit, while blocked resources count as 0.
Calculation Example for Monday:
- Value = sum of bookings / sum of days
- Sum of bookings: Total number of bookings made on Mondays.
- Sum of days: Number of Mondays within the selected time frame.
This calculation helps understand booking patterns for each weekday.
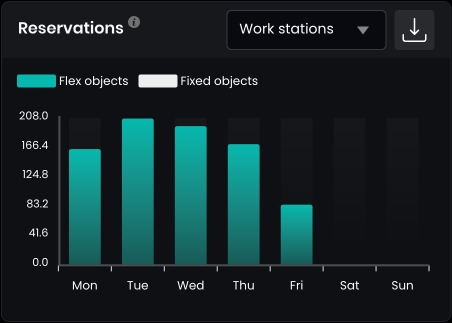
You can scope the statistics based on resource types.
Number of resources
The number of available resources in the system can change over time as desks are added or removed. This statistic provides a daily snapshot based on resource statuses in the past, helping you compare how many resources were utilized relative to all available resources on any given day.
Calculation Example for a Day:
- Flexible resources: Number of flexible resources on the target date.
- Permanently assigned resources: Number of permanently assigned (fixed) resources on the target date.
- Blocked resources: Number of blocked resources on the target date.
- All resources = flexible resources + permanently assigned resources + blocked resources
This reference helps analyze past utilization against total available resources.
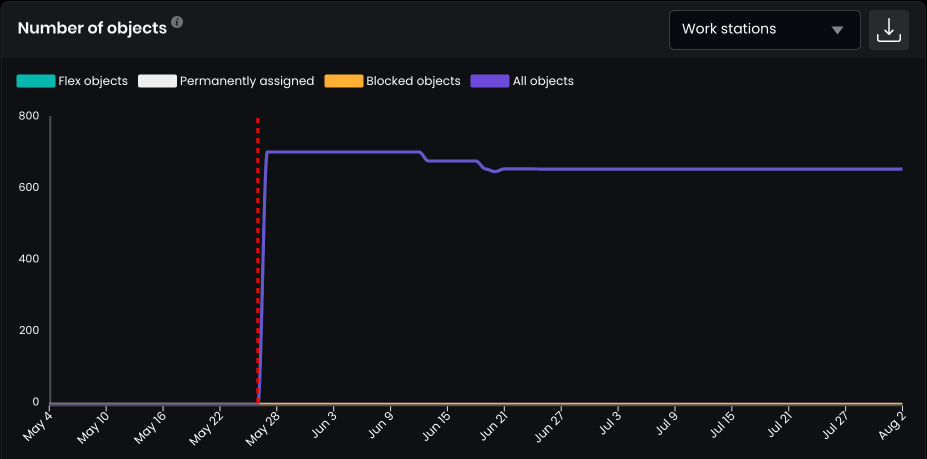
You can scope the statistics based on resource types.
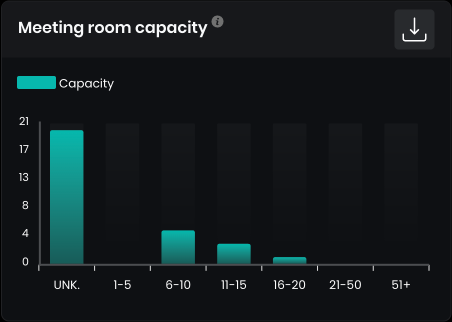
Meeting room capacity (current)
Distribution of the meeting rooms based on their configured capacity. The capacity can be configured for each meeting room individually in the floor plan editor. This statistic shows the actual values and does not include time-based information from the past.
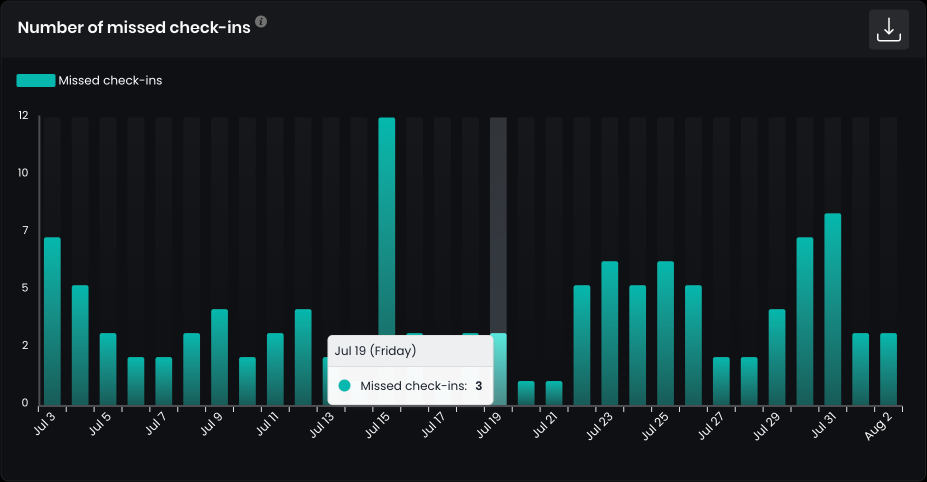
Number of missed check-ins
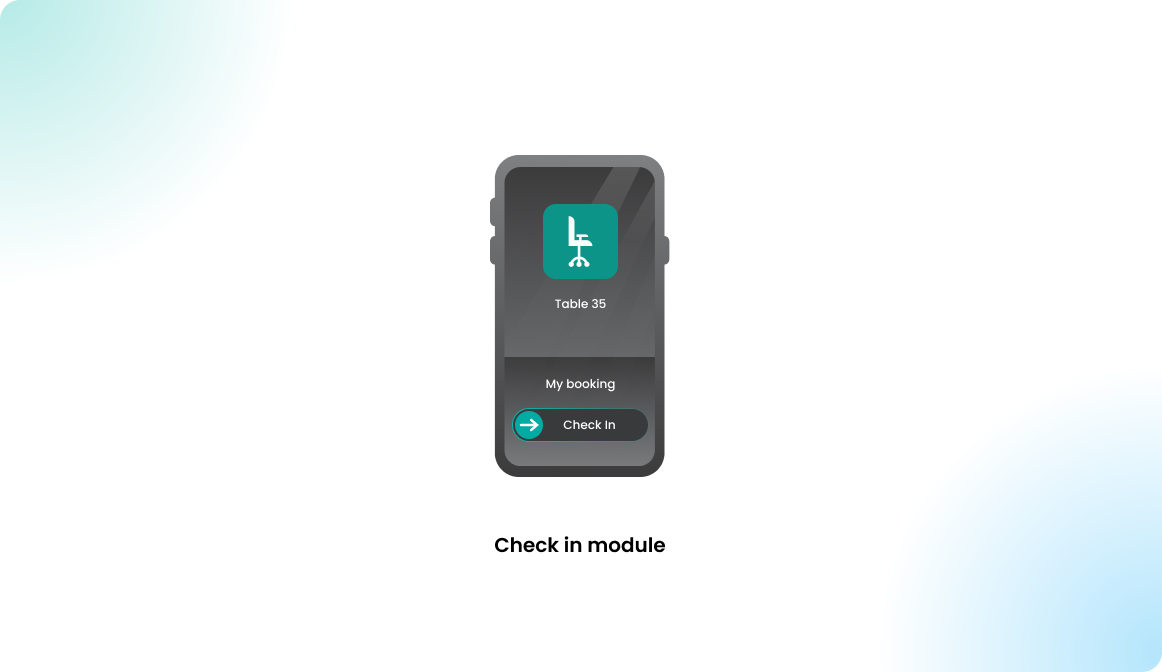
The statistic is only active if you have activated the Check In module in your Flexopus global settings. Learn more about the check in module here:

Calculation example for a day:
The value represents the number of missed check-ins on the target date. It measures how frequently users forget to check in for the reservations they created. This metric helps track user behavior and identify patterns of missed check-ins.
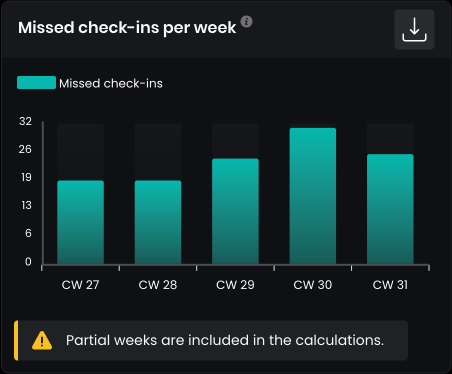
Missed check-ins per week
This statistic is only active if you have activated the Check In module in your Flexopus global settings. Learn more about the check in module here:
Calculation example for a week:
The value represents the number of missed check-ins during the target week. It measures how often users forget to check in for the reservations they created, providing insight into weekly check-in patterns.