Resource Heatmap & Utilization

Overview
The resource heatmap and utilization statistics are generated without using personal data, much like the building statistics. These calculations are based on anonymized reservations, focusing solely on which resource was booked and when. Since user-specific information isn't required for these calculations, the data can be stored indefinitely under GDPR guidelines.
Compared to building and floor plan statistics, these resource-level statistics provide a more in-depth analysis of usage patterns on a specific floor plan.
Resource heatmap
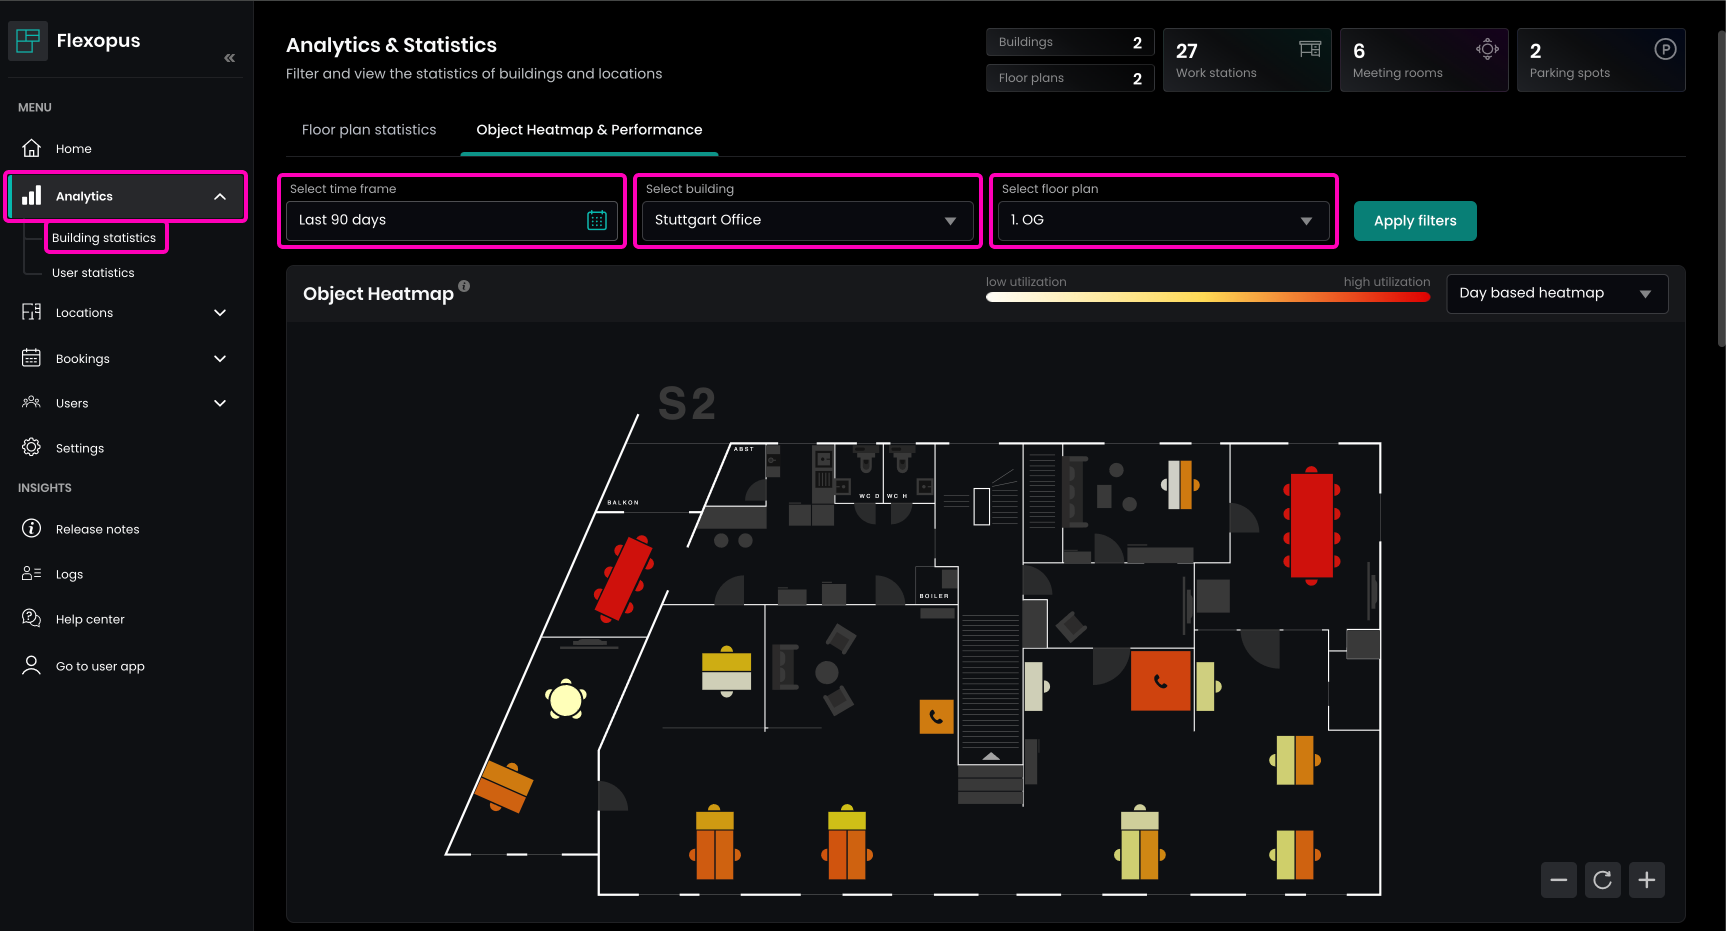
To access the resource heatmap in Flexopus as an administrator:
- Navigate to
Dashboard > Analytics > Building statistics. - Select the
Object Heatmaptab. - Choose the
timeframeand thelocationyou want to analyze.
Make sure to select an exact floor, not just a building, for a detailed analysis.

In any building, some resources are more preferred by colleagues, while others may have lower utilization due to personal preferences or environmental factors. The heatmap helps visualize these anomalies, enabling you to optimize office space based on collected usage data.
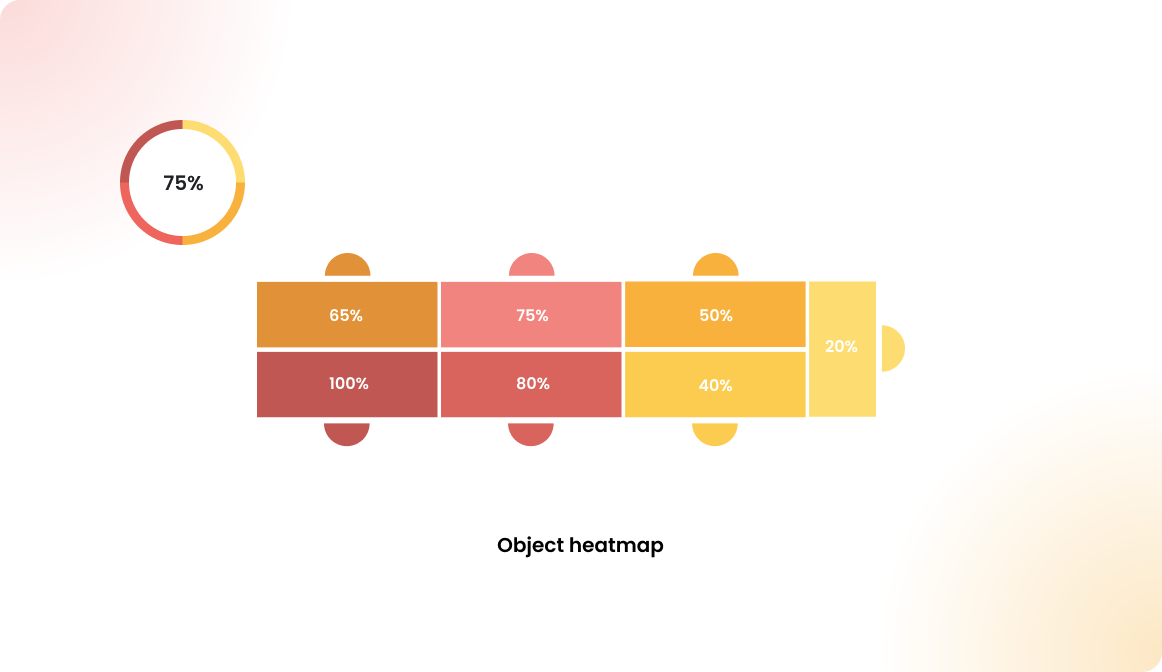
Color coding:
100%
High utilization (resource is frequently booked).0%
Low utilization (resource was never booked in the selected time frame).
You can choose between two types of heatmaps in the upper-right corner:
Day-based utilization
Shows overall usage patterns by day.Hour-based utilization
Displays resource usage broken down by hour.
Day based heatmap
The day-based heatmap calculates the utilization of resources by assuming 100% utilization for the day if the resource was booked at least once, regardless of the booking length. This method is ideal for workstations and parking spots, as they are considered fully utilized if booked once during the day. However, this calculation doesn't work well for meeting rooms, which may need multiple bookings throughout the day. For meeting rooms, we recommend using the hour-based utilization.
Calculation Example for Day-Based Utilization:
Value= sum of booking days / all workdaysSum of booking days: Number of days with at least one booking in the selected time frame, counting only weekdays.All workdays: Number of workdays (excluding weekends, but including holidays) in the selected time frame.
Hour-based utilization
The hour-based utilization is calculated based on the time frame you configure as an administrator in Dashboard > Settings > Analytics settings > Time range. By default, the application uses the work time configuration from the booking settings, but you can set a custom time frame. After changing the time frame, please allow 24 hours for the statistics to be recalculated.
Calculation Example for Hour-Based Utilization:
Value= sum of hours booked / all possible hoursSum of hours booked: The total number of hours with a valid booking within the configured analytics time frame, counting only weekdays.All possible hours: The sum of all available booking hours on workdays in the selected time frame (weekends excluded, holidays included).
This approach is ideal for spaces like meeting rooms, where hourly bookings provide more accurate utilization data.
Example Heatmap
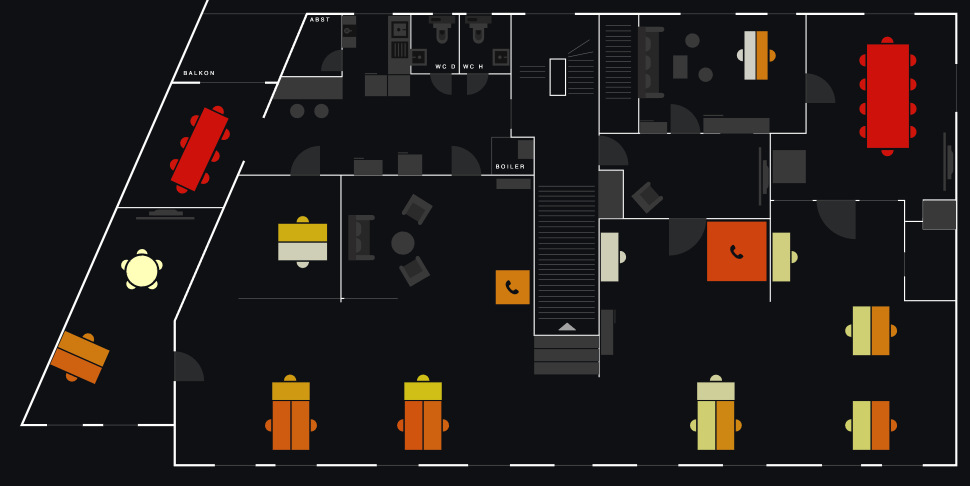
Let's take this office map as an example and analyze the behavior of the colleagues for the past 90 days.

We can detect some behaviors over the last 90 days.

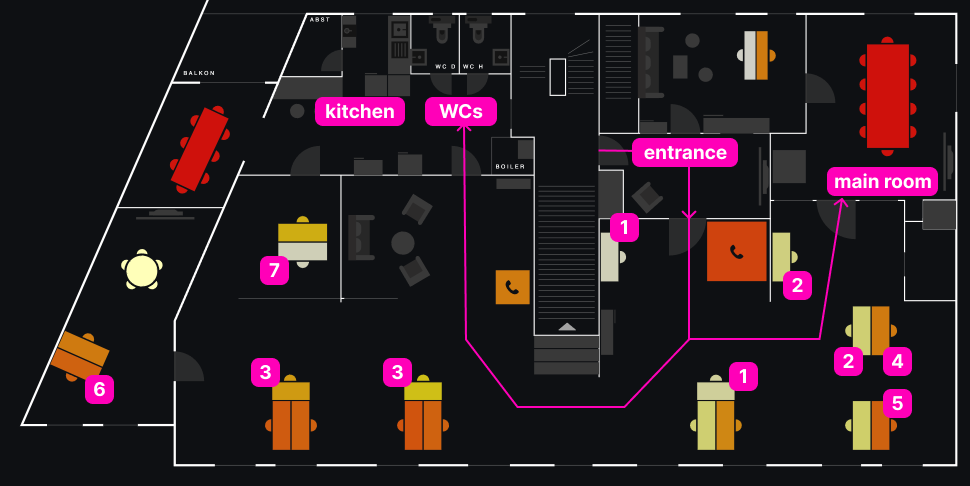
CASE 1: Desk in the entrance area
Workstations near the office entrance tend to be less utilized. These desks are more exposed to people and guests entering the office. Since most people prefer privacy, these desks are less popular.
CASE 2: Desk near larger meeting rooms
Despite being away from the entrance, these desks are still underutilized. The high foot traffic from colleagues entering the big meeting room affects privacy, making these desks less appealing.
CASE 3: T-shaped workstation islands
Desks arranged in a T-shape, with three desks in formation, are more exposed. The middle desk faces the room and has more eye contact with colleagues on both sides. These factors lead to lower utilization.
CASE 4: Cornered desk with hidden monitor
This is a well-utilized desk. It’s hidden, the monitor faces the wall, and access is limited, providing maximum privacy.
CASE 5: Cornered desk with window
Similar to CASE 4, but with a window view of the street, this desk is even more preferred, offering both privacy and a better environment.
CASE 6: Separated room
Private offices with 1–2 workstations are the most booked. These spaces offer maximum privacy, making them highly sought after.
CASE 7: Special equipment
This desk has a special PC for video editing and is used only as a last resort. Low utilization suggests it might be better to relocate this desk.
Other factors that influence utilization:
Smells: Desks near toilets may be avoided.Noise: Desks near kitchens can be noisy.Temperature: Desks near air conditioners might be too cold.Monitor glare: Monitors may have glare from nearby windows.
These factors impact office utilization. If only the “less desirable” desks are available, colleagues may choose to work from home, preventing full utilization. Although demand is there, employees prefer a higher standard than what is available at 70% occupancy.