User Statistics
Overview
The user statistics are created using personal related information. The calculations are based on which user booked what in the past. Please consult your data processing officer to clarify if you are allowed to collect the user statistics.
Under GDPR, personal data should only be stored as long as it serves its defined purpose. In this case, the purpose is to book a resource, and once the booking is completed, the data can be anonymized.
However, if you have another valid reason to store data longer or are outside GDPR jurisdiction, you can retain the bookings and use user-based statistics accordingly.
Configuration
To enable user-based statistics in Flexopus:
- Navigate as an administrator to Dashboard > Settings > Analytics settings.
- Turn on user level statistics.
- Additionally, disable booking anonymization or set the anonymization interval to at least 90 days (as shorter intervals do not provide meaningful statistics).
- After enabling, please wait 24 hours for the data to be calculated, as it updates once per day.
Statistics
To view user statistics in Flexopus, follow these steps:
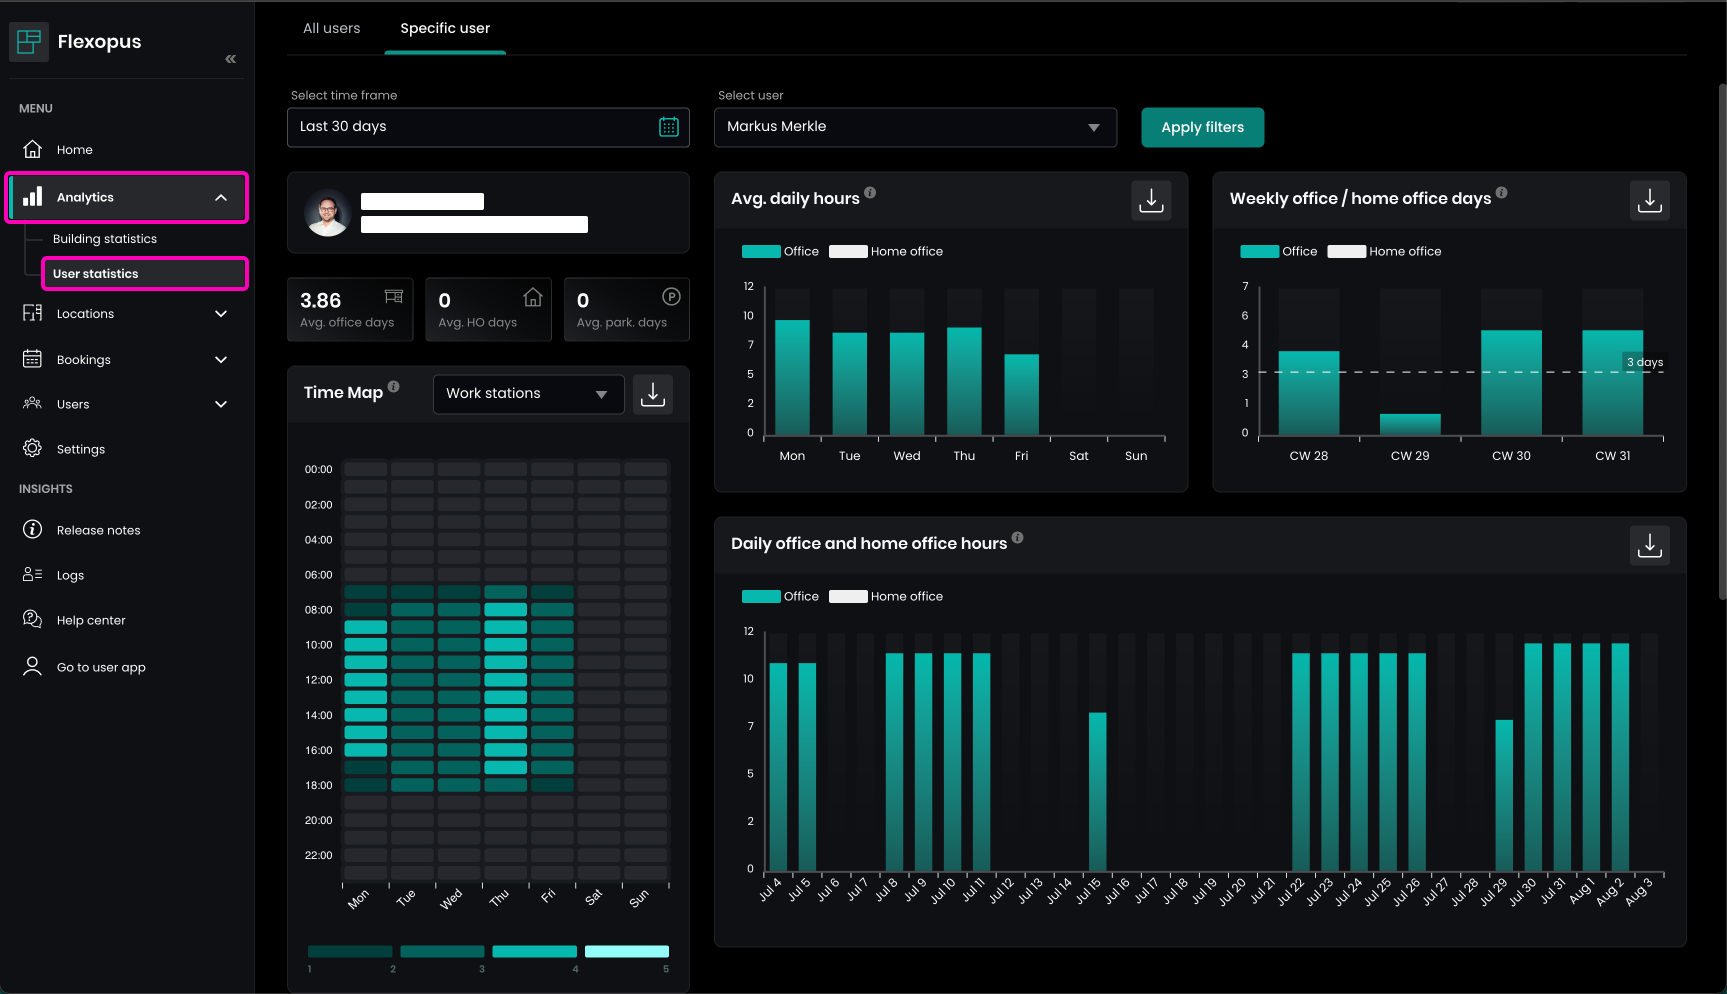
- Navigate as an administrator to Dashboard > Analytics > User statistics.
- Select a user profile.
- Choose a time frame to calculate the statistics.
Please note:
- Options like months, quarters, last 30 days, last 90 days, and current year are precalculated statistics.
- Custom time frames can be up to 90 days and are calculated in real time, which may take longer than precalculated statistics.
- Precalculation runs every night, updating with the latest data, including reservations from the previous day.
Average days
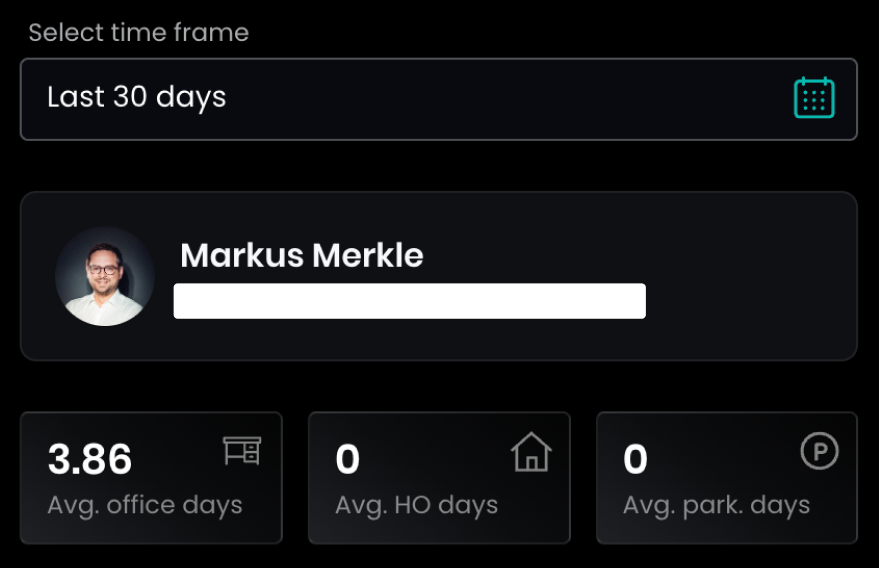
The first KPIs show the average number of bookings per week for office, home office, and parking spots made by the user within the selected time frame:
- Avg. office days: The sum of days with at least one workstation reservation, divided by the number of weeks in the selected time frame.
- Avg. HO days: The sum of days with at least one home office reservation, divided by the number of weeks in the selected time frame.
- Avg. park. days: The sum of days with at least one parking spot reservation, divided by the number of weeks in the selected time frame.
These KPIs give an overview of the user's booking habits over time.
Average daily hours
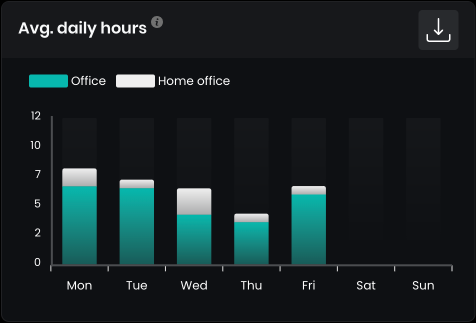
This statistic shows the average number of hours booked per day during the week. It's calculated by taking the sum of workstation or home office reservations in hours for each day of the week, divided by the number of days in the selected time frame.
This helps identify which day of the week is preferred most by the user for office or home office bookings.
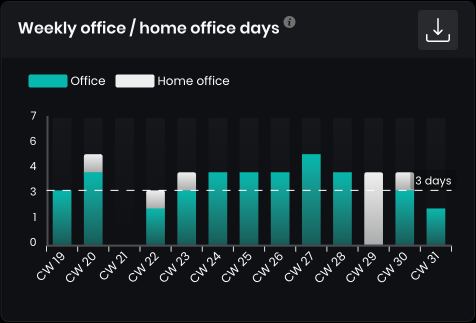
Weekly office / home office days
This statistic shows, on a weekly basis, how often the user chose to go to the office or stayed in the home office. For example, CW 28 refers to Calendar Week 28. A day is counted as an office day if the user made at least one workstation booking on that day.
Time Map
The number of reservations during the week is tracked with 60-minute accuracy to identify when most bookings were made. Both flexible and permanent fixed reservations are counted as 1.
Calculation Example for Monday, 08:00 - 09:00:
- Value = sum of bookings / sum of days
- Sum of bookings: Total number of bookings during the selected time frame for all Mondays in that time slot.
- Sum of days: Total number of Mondays within the selected time frame.
This helps analyze peak booking times throughout the week.
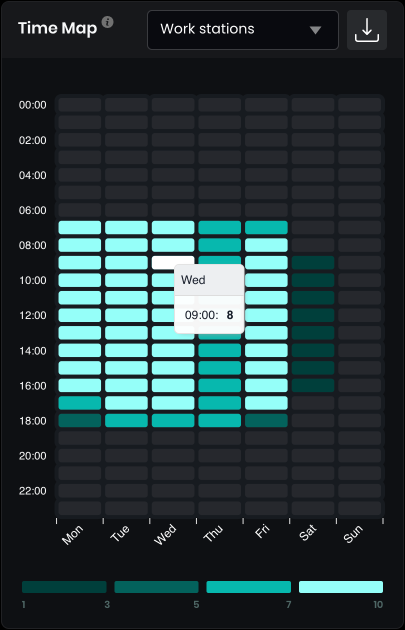
You can scope the statistics based on object types.
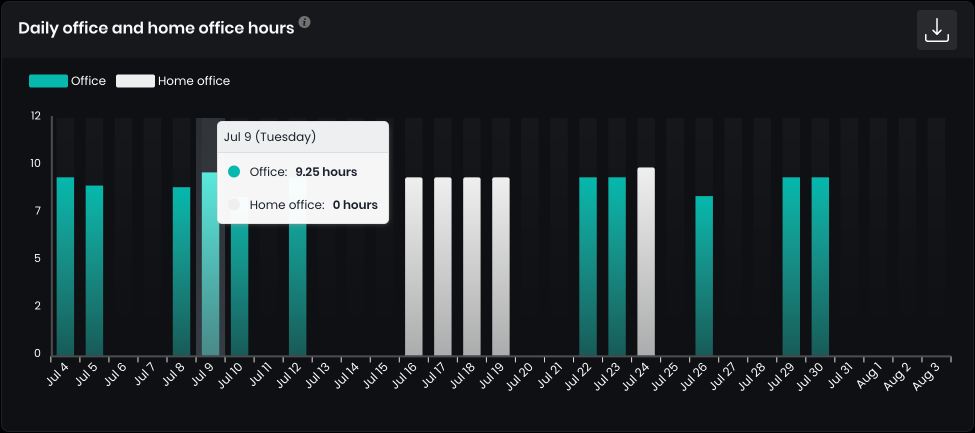
Daily office and home office hours
You can track the user reservations for each day in the selected time frame to have a better overview of the reservations made.
Favorite resources
This feature provides a list of resources the user booked during the selected time frame. You can sort the resources by:
- SUM: To see which resource was occupied the longest.
- NO. BOOKINGS: To see which resource was booked the most frequently.
Additionally, you can export the list in CSV or XLSX format for further analysis.
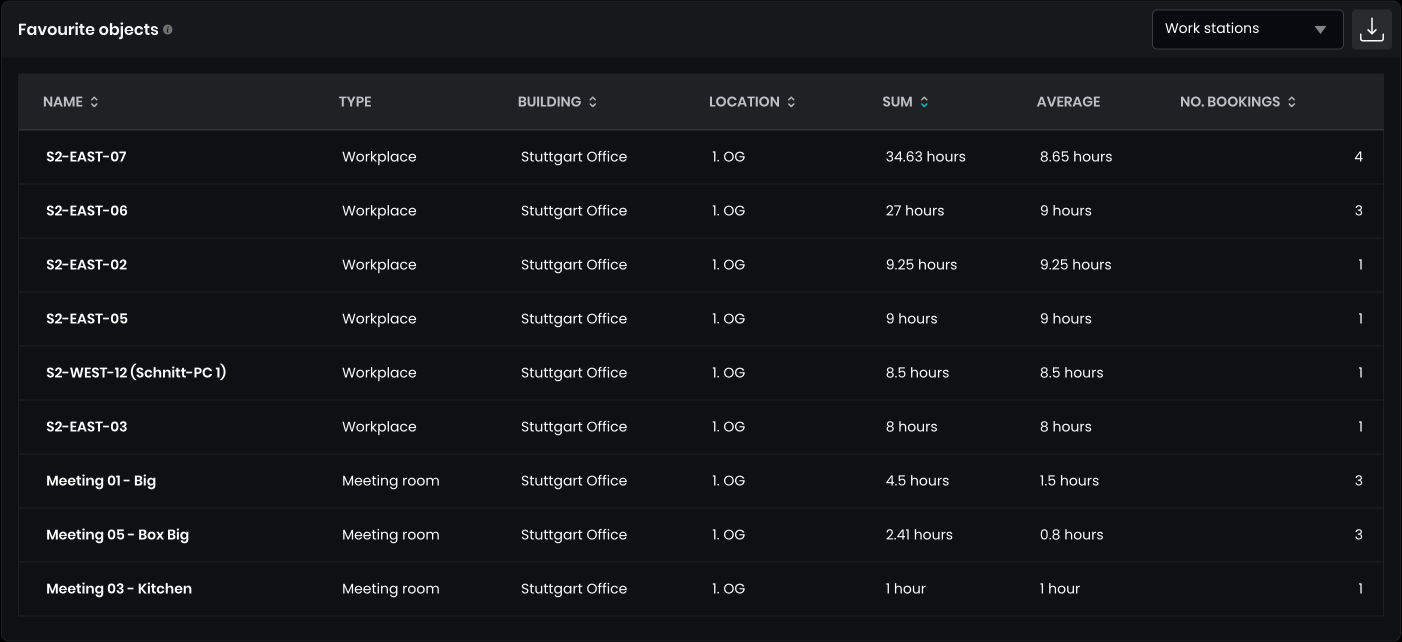
You can scope the statistics based on resource types.
Missed check-ins
The statistic is only active if you have activated the Check In module in your Flexopus global settings. Learn more about the check in module here:
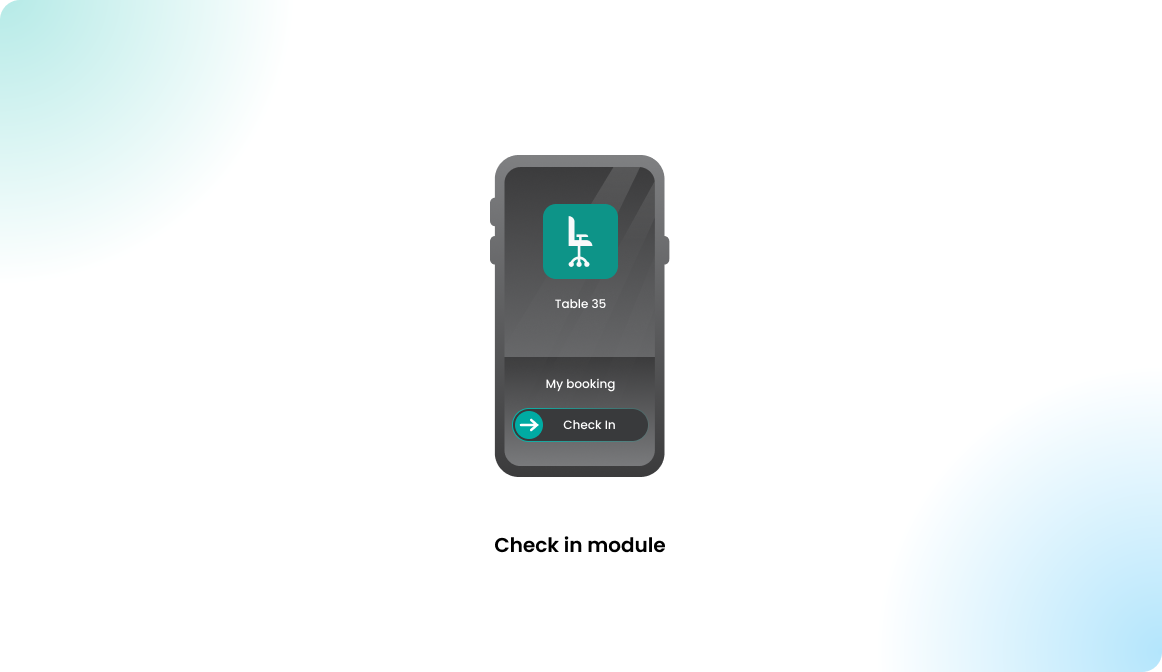
The statistic shows how frequently the user forgot to check in for the reservations he created. The first chart summarizes the missed check ins on a weekly basis.
The second chart shows how many missed check-ins were made compared to valid check-ins.
