How to get insights and analyze the data?

Learn about the Flexopus statistics to analyze your office usage.

You can open the statistics as an administrator in the dashboard application. If you have no access to the menu point, or you can not see some floor plans, then contact your Flexopus administrator. Not all admin users can see the analytics tab.

The system provides 3 main types of analytics

  • Floor plan & Building Statistics
    Analytics > Buildings > Floor plan statistics
    Calculated on office or floor plan level.
    The data is based on anonymized reservation data. To calculate these statistics, the system needs no personal data.
    Learn More
  • Object Heatmap & Performance
    Analytics > Buildings > Heatmap & Performance
    Calculated on the object level on a selected floor plan.
    The data is based on anonymized reservation data. To calculate these statistics, the system needs no personal data.
    Learn More
  • (Optional) User Statistics 
    Navigation: Analytics > Users
    Calculated on the user level
    The data is based on the user's reservation. The connection between the user and the reservations is needed. To use this statistics, you need to set the anonymization parameter in the data protection setting to at least 90 days.
    Learn More

Floor plan & Building Statistics

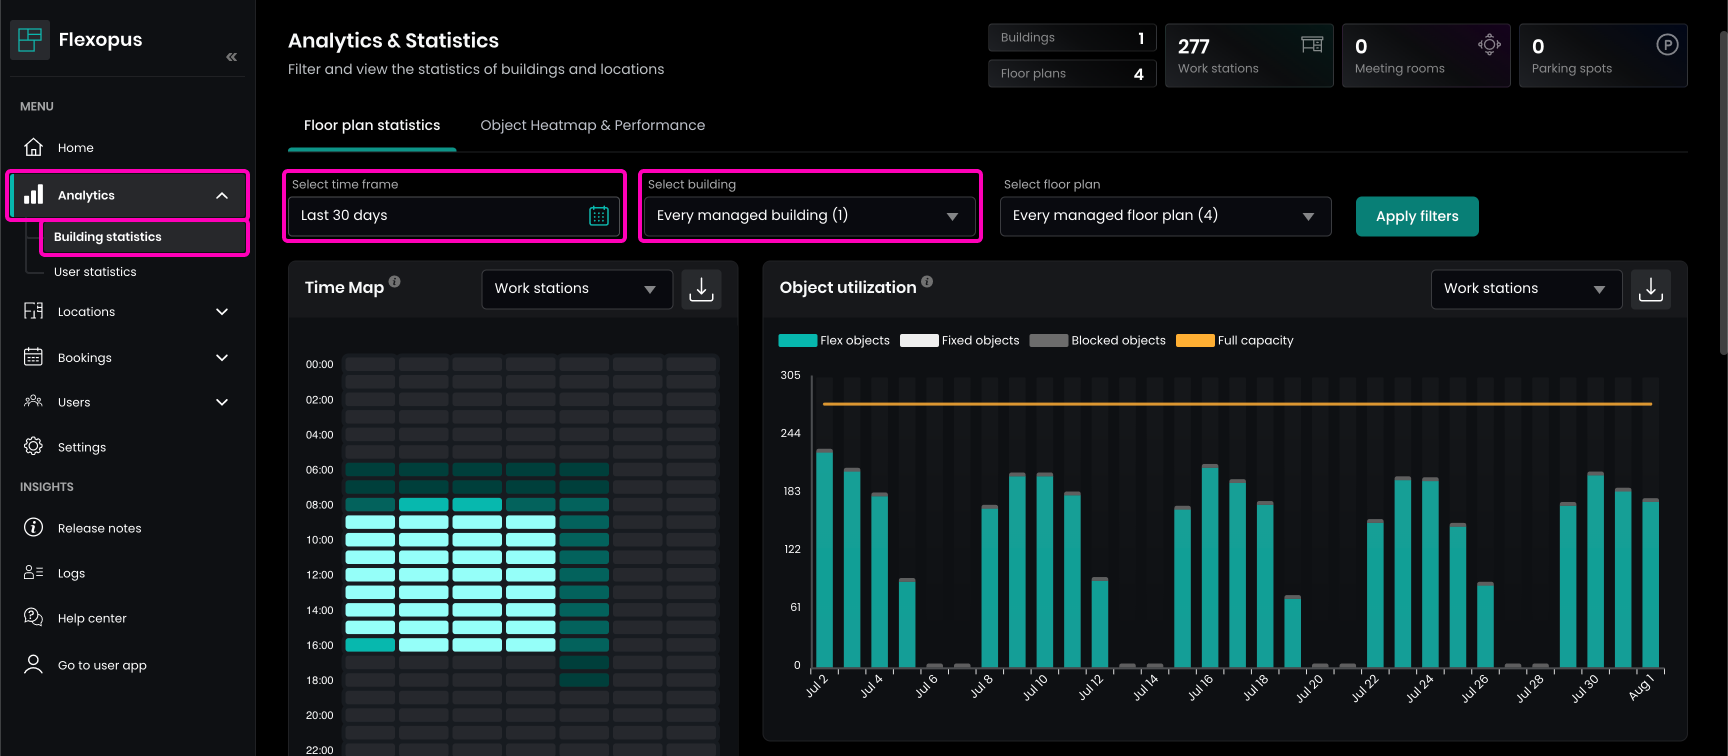
Navigate to Analytics > Buildings > Floor plan statistics to calculate the statistics for an office.
You can select:

  • All building and all floor plans
  • A specific building with all floor plan
  • A specific building with a specific floor plan

To calculate the statistics, you need to select a time frame as well. Please note that the displayed time options like the months, quarters, last 30 days and last 90 days are precalculated statistics. The custom time selection can be maximum 90 days. The custom time frame selection will always be calculated real time, the calculation of custom time frames takes longer than the precalculated statistics. The precalculation runs every night based on the latest data, including the reservation from yesterday.

Statistic types for floor plans and buildings

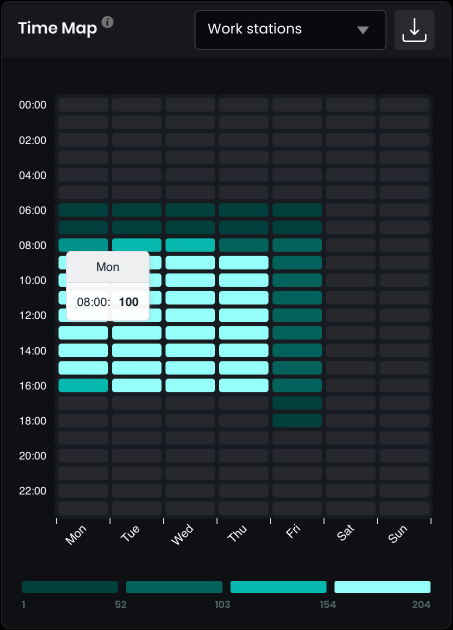
  • Time Map
    Number of reservations during the week with a 60-Min accuracy to see when the most of the colleagues are working in the office. Normal flex reservations are counting as 1. The permanently assigned objects are counted as one. The blocked objects count as 0.
    You can scope the statistic based on object types.
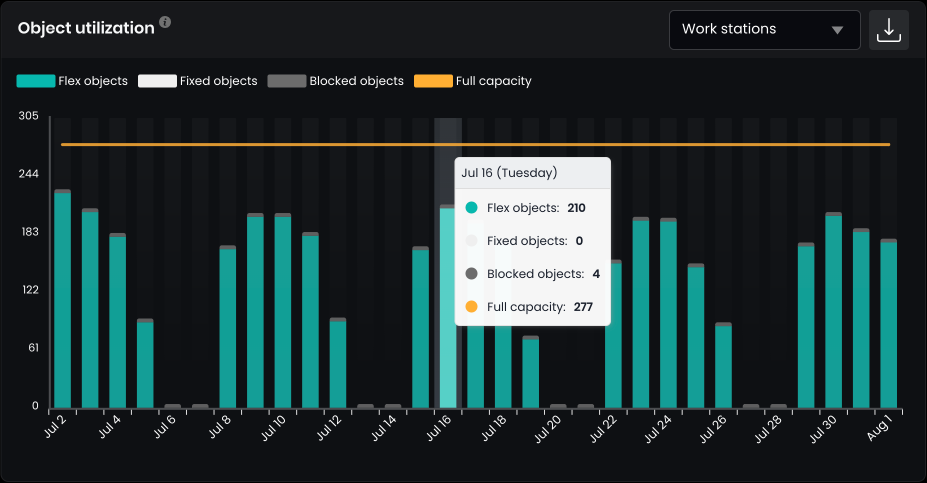
  • Number of booked objects
    Number of booked object over time on the daily basis. If an object is booked, no matter how long, then it's counting as one for the day. You can select to see only the flex objects or all objects. If you select all, then the permanently reserved objects are counted as 1, flex objects as 1 and the blocked or free objects as 0.
    The number of all available and all flex objects may vary based on your office planning day by day. To compare the booked objects, the limits are displayed in the statistics. The limits are historical information. The system saved them every day.
    You can scope the statistic based on object types.
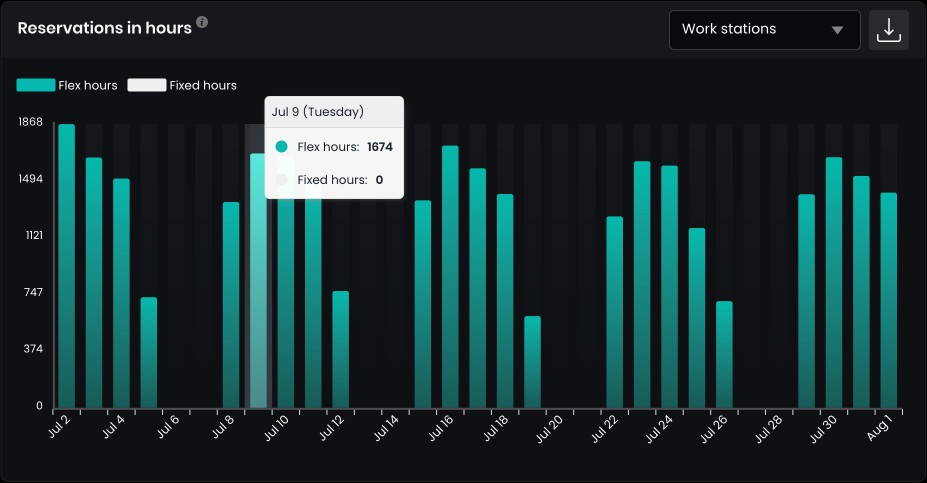
  • Reservations in hours
    Number of all reservation hours on the daily basis. Normal flex reservations and the permanently assigned objects are counted. The blocked objects are not included.
    This metric is relevant to seeing the distribution of working hours over time. Behaviors of the colleagues are easier to analyze in the summary view (drop of office hours on the weekend, holidays), a significant drop can also be an anomaly which can be detected in a short time.
    You can scope the statistic based on object types.
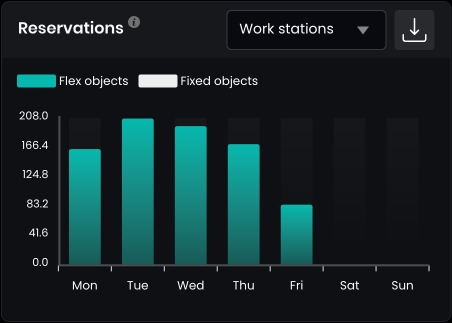
  • Reservations (per day average)
    Sum of booked object in the selected time frame per day of the week. It's an average calculation.  Example: Selected time frame is Q4/2022 (01.10.2022 - 31.12.2022). The number for Monday will be: number of booked object on each Monday separately divided by the number of Mondays in Q4/2022.
    You can scope the statistic based on object types.
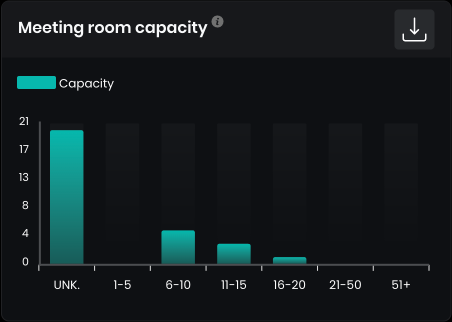
  • Meeting room capacity (current)
    Distribution of the meeting rooms based on their configured size. See the field meeting room capacity for each meeting room.
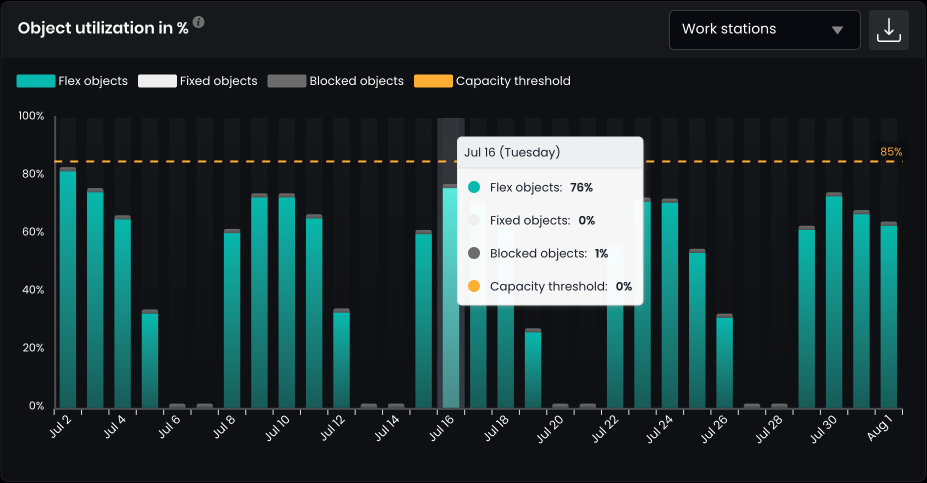
  • Utilization in %
    The utilization percent of a day is calculated by assuming the following: If a flex object is booked at least one time in a day, then it's considered as occupied for the day, so the utilization of the object is 100% on this day. A fixed object is always 100, a blocked object is always 0% for the day.
    The "All object" utilization percent KPI for a floor plan is calculated by summing all the percentages and dividing it by the number of all objects (blocked + flex + fixed) on the floor plan.
    The "Flex objects" utilization percent KPI for a floor plan is calculated by summing the flex object percentages and dividing it by the number of flex objects on the floor plan.
    The number of all available and all flex objects may vary based on your office planning day by day. The system saves the counts every day to have an accurate utilization percent.
    You can scope the statistic based on object types.
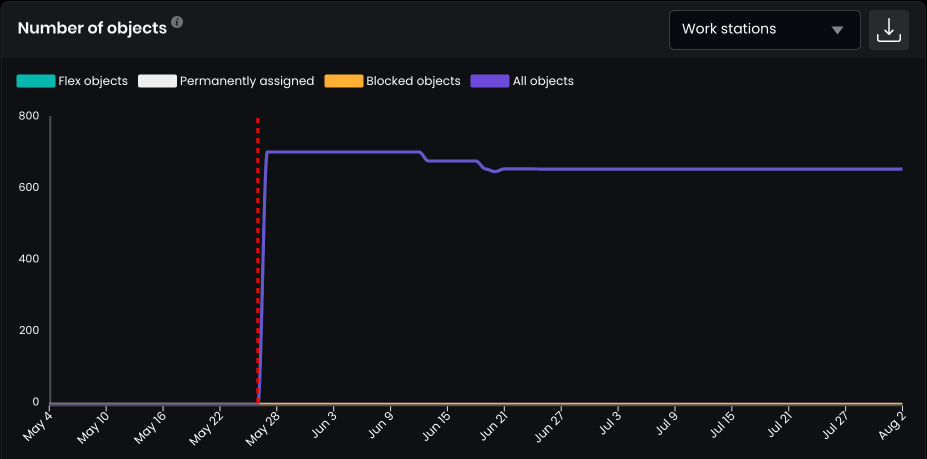
  • Number of objects
    "All objects" - Sum of all objects associated to the selected floor plans.
    "Flex objects" - Sum of flex objects associated to the selected floor plans.
    Permanently assigned - Sum of permanently assigned objects associated to the selected floor plans.
    Blocked objects - Sum of blocked objects associated to the selected floor plans.
    You can scope the statistic based on object types. 
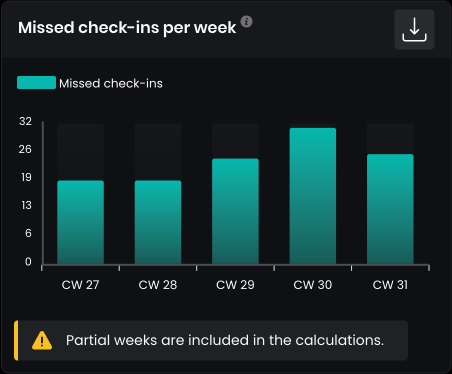
  • (optional) Missed check-in ratio per week
    The statistic is only active, if you have activated the Check In module in your Flexopus global settings (Settings > Booking Settings > Check In and Check out). It measures how often the users forget to check in for the reservation they created. This chart summarizes the missed check ins on a weekly basis.

Object Heatmap & Performance

Navigate to Analytics > Buildings > Object Heatmap & Performance to calculate the statistics for a floor plan. Compared to the building and floor plan statistics, this type of statistic goes one abstraction level deeper to analyze the objects on a selected floor plan.

How to use?

  1. Select a specific floor plan
  2. Select the time frame you wish to analyze.
    Use the preconfigured time frames or select a custom time frame up to 90 days.
  3. Hover on the objects with your mouse to see the KPIs, or scroll down to see the objects in the table.

The heatmap calculates the following KPIs for each object:

  • Sum of hours
    Summarize the length of all bookings created for the object in the preselected time period.
  • Average
    Divides the sum of hours by the number of days when there was a reservation for the object.
  • Utilization % (daily)
    The utilization percentage (daily) of an object is calculated by assuming the following: If the object is booked at least one time in a day, then it's considered as 100% occupied for the day. A fixed object is always 100%, a blocked object is always 0% for the day. The heatmap percent summarizes every workday percentage and divides it by the number of workdays.
    Workdays do not include Saturday and Sunday.
    Recommended for work station and parking spot utilization.
    The coloring of the map is based on this value. 100% is a high utilization, which means that the object is booked very often. 0% is a low utilization, which means that the object was never booked in the selected time frame.
  • Utilization % (mins)
    The utilization percentage (mins) of an object is calculated by calculating the exact minute based utilization of the object during the day in the predefined analytics core hours (Settings > Analytics Settings > Analyitics core hours). The heatmap percent summarizes every workday percentage and divides it by the number of workdays.
    Workdays do not include Saturday and Sunday.
    Recommended for meeting room utilization.
    Example 1:
    Analytics core working hours are 08:00 - 16:00 (8 hours period, 480 mins), if a reservation is made from 08:00 - 12:00 (4 hours, 240 min), then the utilization will be 240 mins / 480 mins = 0,5, which is 50%.
    Example 2:
    Analytics core working hours are 08:00 - 16:00 (8 hours period, 480 mins), if two reservations are made from 08:00 - 09:00 (1 hours, 60 mins) and 15:30 - 16:30 (60 min, but only 30 min is in the analytics core hours.), then the utilization will be 90 mins / 480 mins = 0,1875 which is 18,75%.
  • No. Bookings
    Number of bookings. Count of days with at least one reservation in the preselected time frame.

(Optional) User Statistics

Navigate to Analytics > User Statistics to see the personalized statistics of the users. Compared to the building and floor plan statistics, this type of statistic using user realted data and not anonimized data. The system need to know which reservation correspondes to which user at least 90 days in the past. 

Important!
The Settings > Data Privacy Settings > Booking anonimization setting need to be off or activated and set to at least 90 days to calculate the user level statistics.  Note that the calculation of the user level statistics need be discussed with the Data Protection Responsible / Chief Data Protection Officer of your company!

To enable the calculation of the user level statistics you need to enable it in the Settings > Analytics Settings tab. The option is turned off by default. If you decide to activate it, you need to wait at least 24 hours until the statistics appear in the system.

The user statistcs calculates the following KPIs for each user.

  • Avarage office days
    Sum of days with at least one working station reservation in the selected time frame divided by the number of weeks in the time frame. 
  • Avarage home office days
    Sum of days with at least one home office reservation in the selected time frame divided by the number of weeks in the time frame. 
  • Avarage parking days
    Sum of days with at least one parking spot reservation in the selected time frame divided by the number of weeks in the time frame. 
  • Avarage daily hours
    Sum of the working station or home office reservations hours for each day of the week divided by the number of days in the selected time frame (Example: number of Mondays). 
  • Weekly office / home office days
    Sum of the working station or home office reservations days for each week in the selected time frame. CW = Calendar Week.
  • Time Map
    Number of reservations during the week with a 60-Min accuracy to see when the most of the reservationns were made. Normal flex reservations are counting as 1. The permanently assigned objects are counted as one.
    You can scope the statistic based on object types.
  • Daily office and home offcice hours
    Tracks the user reservations for each day in the selected time frame.
  • Favourite objects
    List of objects that the user booked in the selected time frame. Sort the objects by the SUM to see which object was occupied the most or by the NO. BOOKINGS to see which object was booked the most often.
    You can export the list as an XLSX.
    You can scope the statistic based on object types. 
  • (Optional) Weekly missed check in count
    The statistic is only active, if you have activated the Check In module in your Flexopus global settings (Settings > Booking Settings > Check In and Check out).
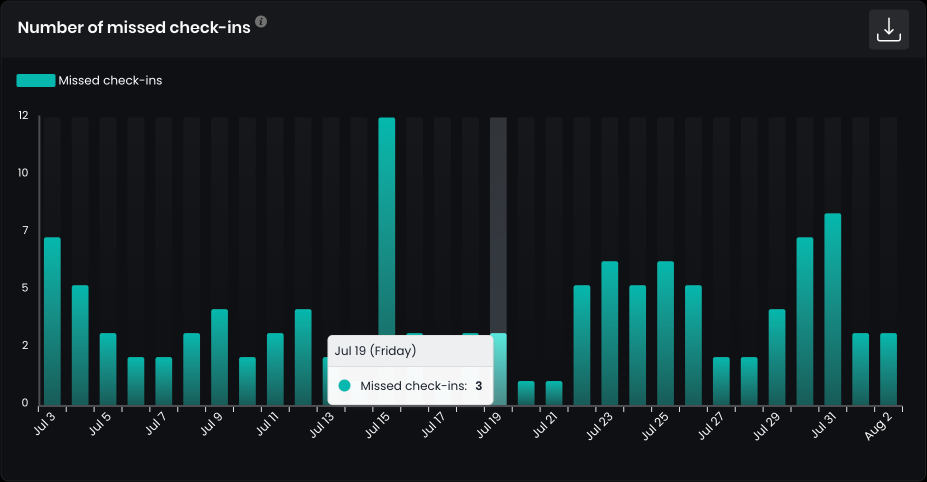
    It measures how often the user forget to check in for the reservation he/she created. This chart summarizes the missed check ins on a weekly basis.
  • (Optional) Missed check in ratio
    The statistic is only active, if you have activated the Check In module in your Flexopus global settings (Settings > Booking Settings > Check In and Check out).
    It measures how often the user forget to check in for the reservation he/she created compared to the reservation he checked in.

Notes and remarks

Remarks for permanent desk reservations

The reservation duration of the permanently reserved so-called fixed objects are oriented to the configured default reservation hours. (Settings > Booking Settings > Default start time & Default end time)
Example: The configuration is 08:00 for the default reservation start and 17:00 for the default reservation end, then the system will count the permanent desk like a flex reservation from 08:00 - 17:00 with a sum of 9 hours.

Remarks for the utilization percentages (desks and parking spots)

In previous versions of Flexopus (before v2.22) we calculated the heatmap percentage and the utilization percentage KPIs for the desks and parking spots based on the number of hours that were booked during the day in the predefined default reservation time. 
Example:
Core working hours are 08:00 - 16:00 (8 hours period), if a reservation is made from 08:00 - 12:00 (4 hours) or 10:00 - 14:00 (4 hours), then the utilization was 50%. This way of utilization calculation is mathematically correct. BUT it ignores the following assumptions:

  • Working behavior of the majority of office workers
    People are either going to work to the office for a full day (example: 08:00 - 17:00) or for the first half of the day (08:00 - 13:00). It's not common to go to the office only for the afternoon hours (13:00 - 17:00). Of course, there are colleagues who may do this, but again, it's not a common working behavior based on our current knowledge. In this way, the 50% utilization KPI could lead to false assumptions for the facility management. You may think that you have more than enough office space left, although there is only available office space in the afternoon, which does not fulfill the needs of the coworkers. We need to be more strict in the way how we calculate the utilization of the spaces. So we assume that if a desk is booked at least one time of a day, then it's 100% occupied for the day.
    Applies to work stations and parking spots.

Remarks for the utilization percentages (desks and parking spots)

  • Meeting room utilization
    The utilization calculation for meeting rooms needs to be strict. We need to calculate the utilization percent on the hourly basis in a preselected time frame.

Remarks for customers with offices in multiple time zones

  1. The statistics are always displayed in the time zone of the office.
  2. If you select the option all offices, then the statistics will be displayed in the main time zone of your Flexopus instance.

R0084